How to read this page in two minutes
Think of the COD Form as a small shop counter. Sessions is how many people walked up to the counter, Orders is how many bought, and Conversion rate is the share who bought. If your conversion rate is low, look at the Funnel below to see at which step people walk away. Check this page once a week, and again a few days after every change you make (a new offer, a shorter form, a different button). Compare with the previous period so you can tell whether the change helped.1. Filters and key numbers
At the top, choose the period with Last 7 days, Last 30 days or Last 90 days, or set your own From and To dates. You can narrow the data by Country, Device and Product, and tick Compare with the previous period to see how the numbers moved. Export CSV downloads the data. The cards show: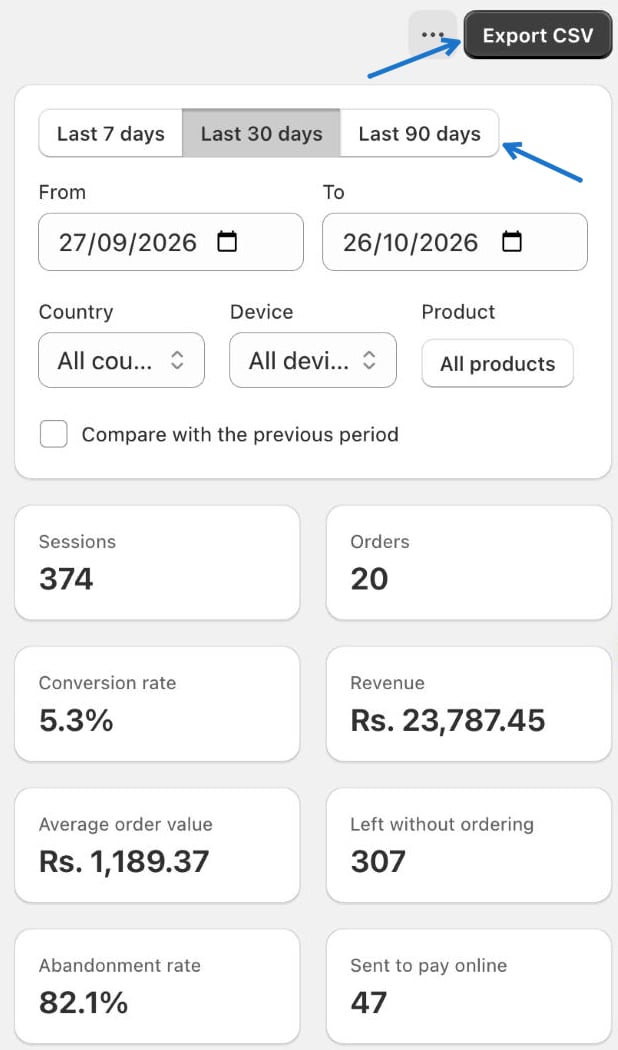
2. Funnel
The Funnel shows the steps shoppers go through: Button views, Form opens, Started typing, Shipping selected, Submit attempts and Orders. The percentage next to each step is the share of shoppers who came from the step before.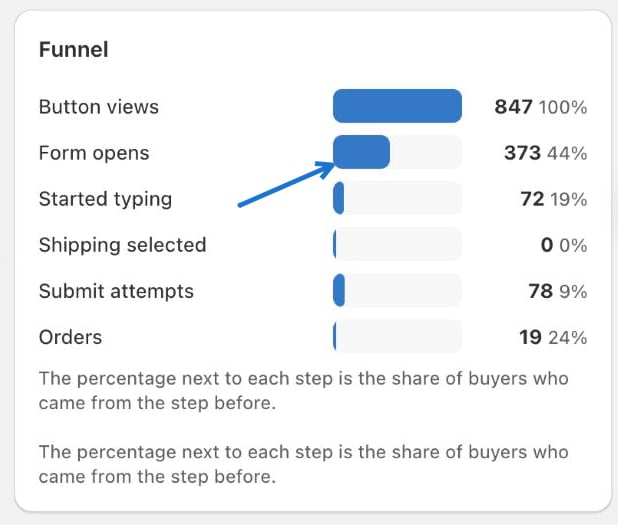
3. Trends and breakdowns
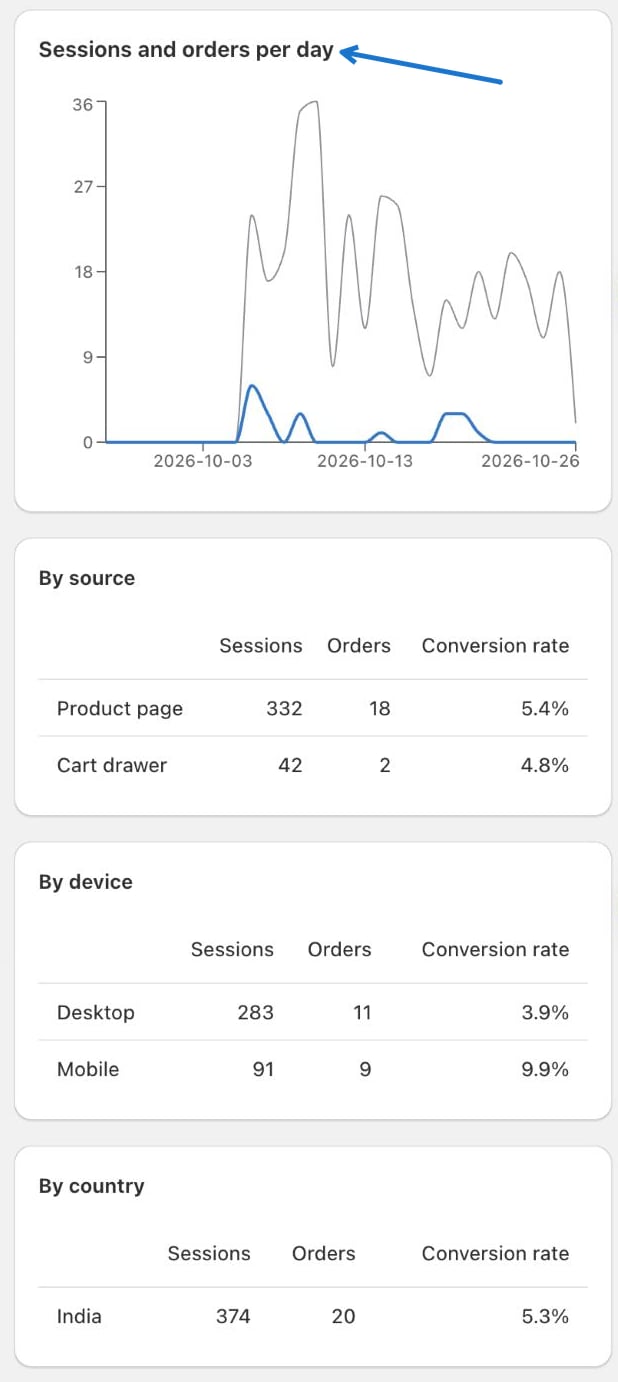
- Sessions and orders per day — a chart of both over the period.
- By source — product page versus cart drawer and other places the button shows.
- By device — desktop versus mobile.
- By country — sessions, orders and conversion rate per country.
- Latest sessions — the most recent form sessions with time, source, device, country and outcome.
Fraud protection
Check the form is not letting unwanted orders through.
Advanced settings
Fine-tune shipping, limits and abandoned forms.